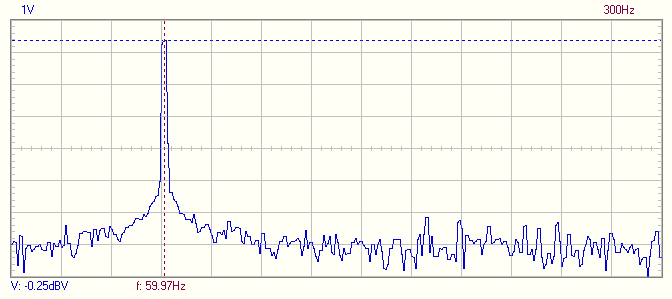
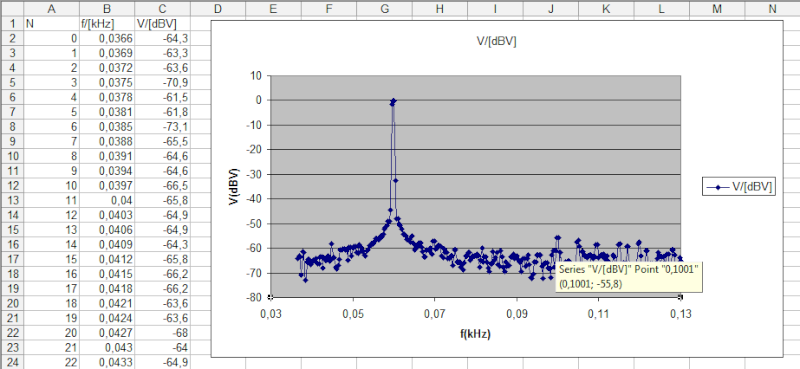
I was using the PCSU1000 to measure harmonics of 60 Hz being induced into railroad signal equipment by a power line. I recorded the pictures of the spectrums which show the voltage per unit of 0.1 volt and range of 300 Hz. The highest harmonic doesn’t seem to have any relationship to the unit scale in volts or db. Is there any way to determine what voltage the highest harmonic was at when I took the picture?
When I connect the unit to an audio oscillator, the peak voltage shown on the spectrum analyzer display doesn’t seem to have any relationship to the input voltage. If I change scale from .2 v per division to .1 v per division, the height of the peak voltage changes very little, but the height of the harmonics increase. Is this all in db even though the scales are in volts?
I wish the instructions were more detailed for those of us who have never used a spectrum analyzer before.

