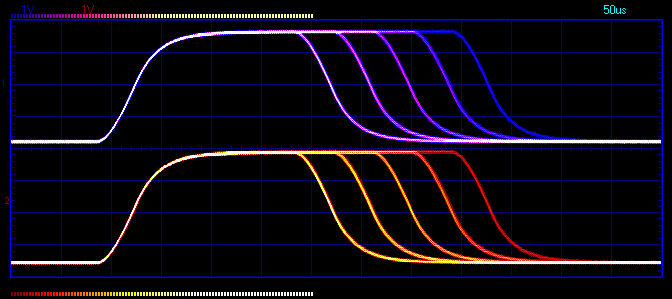
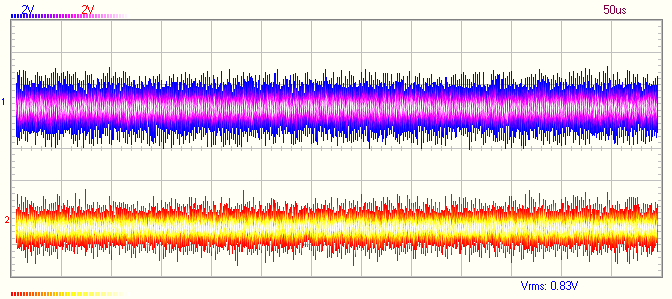
Here is my first “DPO”-gramm:

At a glance:
[ol]
[li]Gradation scale works only for second channel. The first channel is just yellow only, without gradations. The OS is Windows Vista x86 with all Microsoft updates.[/li]
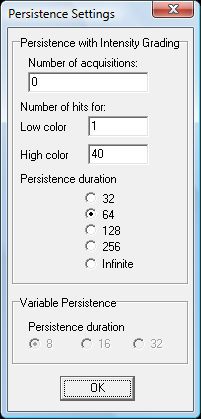
[li]The “Number of acquisitions” counter works only one time after entering value and pressing “OK” in Options. It didn’t work at the next runs or persistent mode activations unless You press “OK” in persistent mode options.[/li]
[li]Custom saturation limits for both minimum and maximum are needed.[/li]
[li]Logarithmic scale may be useful.[/li]
[li]Controllable fade period is needed.[/li]
[li]Spatial aliasing for color gradation may be useful.[/li][/ol]
The third point can help to highlight the area of interest, for example when there are noise traces (minimum level involved) or not so high signal-of-interest probability (maximum saturation level involved). There can be two saturation sliders for gradations: min and max. All pixels which have less count than minimum level, should be displayed by one color - the color of scale beginning. All pixels which have a count higher than maximum saturation level, should be colored by one color of the end of scale. All pixels between minimum and maximum saturation levels should have appropriate scale gradations. The analogy for this sliders - the “Levels” sliders in most of photo editing software. They can help to tune the “contrast” of diagram.
The fourth point. I suppose it can be useful in case of high trace numbers and high “dynamic range” of traces probabilities in areas of interest. It can be used for statistical analysis.
The fifth point is interesting and mandatory. As I’ve understood, there is simple accumulation in current persistence realization. It’s not quite appropriate method. When there is simple accumulating, the gradation on diagram depends only on trace count through certain pixel. Such approach is quantitative analysis. But I’m interesting in qualitative one too. As qualitative analysis I have in mind the probability representation. I.e. the diagram should stabilize after sufficient number of traces and should represent the probability of the trace pass at certain diagram pixel. In current realization it’s not is the case. The diagram goes to saturation.
As I’ve wrote before, the pixel gradation should be determined by division of pixel counter by number of traces. Then it should be scaled into gradation range with regard to min and max saturation levels.
The fade function can decrease all array counters simultaneously at each acquisition for certain decrement in “probability” persistent representation. There are floating point counters for diagram pixels needed because need of smooth fading speed adjustment. With higher decrement value the fading will be faster.
I’ll try to formulate.
I’m suggesting the following user controlled parameters for intensity grading persistence mode:
[ul][li]AcquisitionsNumber:=0 [0…N). Implemented in current release.[/li]
[li]SaturationMax:=1 (0…1].[/li]
[li]SaturationMin:=0 [0…SaturationMax).[/li]
[li]FadingSpeed [0…1]. With FadingSpeed=0 there will be simple probability accounting through the whole persistent mode operation. All of the acquired traces will be displayed if SaturationMin=0. If FadingSpeed is higher than 0, there fill be fade of the probability picture at each next acquisition. If FadingSpeed is 1, only the last trace can be displayed, so the “FadingSpeed” parameter can regulate the “degree of persistence”.[/li][/ul]
At persistence mode start:
PixelCounter():=0;
TraceNumber:=0.
After each acquisition:
TraceNumber:=TraceNumber+1;
For each diagram pixel:
	If TraceHit(x,y)=true then PixelCounter(x,y):=PixelCounter(x,y)+1;
	Probability(x,y):=PixelCounter(x,y)/TraceNumber;
	If Probability(x,y)>0 and Probability(x,y)<SaturationMin then ScaleValue(x,y):=ScaleMin else {
		If Probability(x,y)>SaturationMax then ScaleValue(x,y):=ScaleMax else {
			ScaleValue(x,y):=(Probability(x,y)-SaturationMin)/(SaturationMax-SaturationMin)
		}
	}
	PixelCounter(x,y):=PixelCounter(x,y)-FadingSpeed;
	If PixelCounter(x,y)<0 then PixelCounter(x,y):=0;
Update screen by ScaleValue() array;
Repeat until Number of acquisitions limit.
This algorithm with suggested parameters can smoothly regulate DSO screen from classic scope to storage scope in persistent mode. For example there are several mode equivalences:
[ul][li]Classic digital scope: FadingSpeed:=1; SaturationMax:=1; SaturationMin:=0. Will be displayed only the last trace without gradations.[/li]
[li]PCLAB2000SE old persistence mode: FadingSpeed:=0; SaturationMax:=1; SaturationMin:=0.99999999999. All acuqired traces will be displayed without gradations.[/li]
[li]Probability map: FadingSpeed:=0; SaturationMax:=1; SaturationMin:=0. All acuired traces will be displayed with gradations of trace probability at certain diagram point.[/li]
[li]“Analog scope”: FadingSpeed:=0.01; SaturationMax:=1; SaturationMin:=0. Like a “Probability map”, but with fading like on CRT-scope.[/li][/ul]
I didn’t consider the logarithmic representation, which can be introduced by proper probability(x,y) normalization…
Six point. The aliasing for the pixels of each trace can be applied. The sharp steps on each trace with tilt between 0 and 90 degrees are visible. Aliasing for each pixel line can help to plot more analog-like diagram.