Hey
I have been using the PCSU1000 oscilloscope for some time, and it seems to be a great tool 
The only thing I have been missing so far, is the possibility to show the units on the axes in pclab2000. Is it anyway possible?
For example:

Hey
I have been using the PCSU1000 oscilloscope for some time, and it seems to be a great tool
The only thing I have been missing so far, is the possibility to show the units on the axes in pclab2000. Is it anyway possible?
For example:
Thank you for this suggestion to improve the PcLab2000 software.
Now the markers (cursors) are used to check the frequency and the absolute voltage and/or the voltage difference in dB.
I’m afraid there in the PCSU1000 are too many zoom and scroll options to handle the labels nicely…
There is a workaround to get the labels for documentation:
Select File/Save FFT Data
Open the saved file in Excel.
Select the columns f/[kHz] and V/[dBV] and create an XY Scatter chart.
Here an example:

Here the same data shown on the PCSU1000 screen:
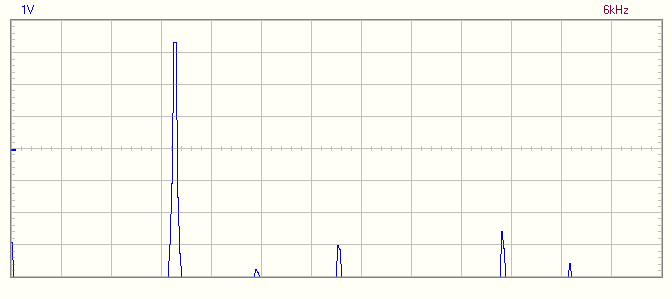
The data values below the screen area are also plotted to the data file.