Noise levels for PCSU1000 (advice needed pls)

Hi,

I have just purchased the Velleman PCSU1000, it all seems like a nice piece of equipment but I have a query as to the noise levels of this unit.

I want to measure the noise & distortion level in an amplifier circuit, I thought the spectrum analyser would be the best for this?, I have managed to take readings of distortion levels of second harmonics etc… but I am having a problem with the overall noise level.

I know my amplifier circuit has a noise floor of approx -90dB, however when I use the spectrum anaylser of the PCSU1000, whatever I connect I only ever see a noise floor of -60dB on the screen.

Even with no input connected, or the probe shorted to GND, I still see the noise at -60dB.

Is this the noise level of the PCSU1000? or am I doing something wrong in using the spectrum analyser to try & measure something like noise? is there a better way?

Here is how you can reduce the noise.
First select Options -> FFT Window -> Hanning
Then select Options -> FFT Options -> Vector Average
Now you have to use the trigger of the oscilloscope.
Here a snippet from the Help:
“[color=#008000]Vector Average
Use this averaging mode to reduce random or uncorrelated noise in the synchronous signal you want to display.
Vector averaging requires a trigger - set Trigger ON.
The signal of interest must be both periodic and phase synchronous with the trigger.
Vector averaging reduces the noise floor for random signals since they are not phase coherent from time record to time record.
If not trigged, the signal will not add in phase and instead will cancel randomly[/color]”

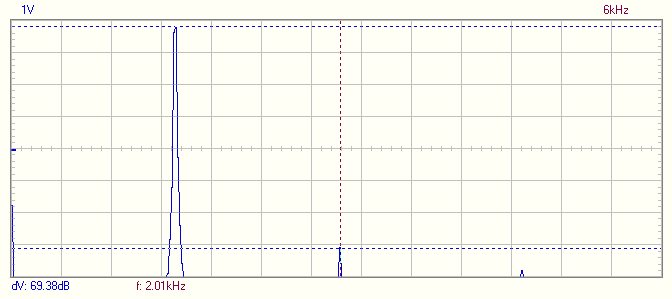
Here an example screenshot image:

The input was from the function generator PCGU1000.

Thanks for the prompt & excellent reply! I have always been impressed by the service & help from Velleman.

I just tried what you suggested & it’s made it SO much easier to pick out the individual 2nd, 3rd, 4th harmonics.

May I just ask your advice, I have a 1kHz sine wave which is quite pure & has a THD of approx 0.001%, however when using the spectrum anaylser on the PCSU1000, while my calculations at this stage could also be questionable, the best I can calculate this to using the PCSU1000 is a THD of approx 0.3%.

In your experience, is it unrealistic to expect to be able to calculate a THD of around these kind of figures of 0.001% etc using the PCSU1000?

The input amplifier of the PCSU1000 is OPA354.
ti.com/lit/ds/symlink/opa354.pdf
The specified distortion of this amplifier for the 2nd harmonic is -75dBc and for the 3rd harmonic is -83dBc.
The second amplifier is LMH6724
ti.com/lit/ds/symlink/lmh6724.pdf
The specified distortion of this amplifier for the 2nd harmonic is -65dBc and for the 3rd harmonic is -63dBc.
So the theoretical lowest measurable distortion is 0.07%.

[quote=“audioguy”]Thanks for the prompt & excellent reply! I have always been impressed by the service & help from Velleman.

I just tried what you suggested & it’s made it SO much easier to pick out the individual 2nd, 3rd, 4th harmonics.

May I just ask your advice, I have a 1kHz sine wave which is quite pure & has a THD of approx 0.001%, however when using the spectrum anaylser on the PCSU1000, while my calculations at this stage could also be questionable, the best I can calculate this to using the PCSU1000 is a THD of approx 0.3%.

In your experience, is it unrealistic to expect to be able to calculate a THD of around these kind of figures of 0.001% etc using the PCSU1000?[/quote]

It is an unrealistic expectation for the PCSU1000, and in fact for most digital 'scopes–here’s why.

To observe 0.001% distortion accurately would require the displayed amplitude of the highest harmonic to be at least 100 db below that of the primary frequency. However as most DSOs use 8-bit analog-to-digital converters (ADCs) their best case theoretical analog dynamic range is 48 dB, I.e. a measurement/noise floor of -48 dB.

Good news however is that when using the FFT function there is a noise floor improvement (NFI), that is a factor of the frequency resolution (FR) of the capture data, per this formula (this is what pushed your originally observed noise floor down to -60 dB):

Noise Floor Improvement (dB) = 10 * log10(FR) * k

where
[ul]FR is the reciprocal of the waveform capture time;
k is a factor (1 to as much as 3) dependent on the chosen windowing function;[/ul]

Based on the image posted by VEL225 I am guesstimating the frequency resolution to be 30 Hz or so (BTW, it would be neat if the FR could be displayed on the FFT screen), plugging that into the above formula and using a k of 1.0 we get:

NFI = 10 * log10(30) * 1.0 = 14.8 dB, making the total dynamic range 48.0 + 14.8 = 62.78 dB; making a positive harmonic amplitude observation limit of -55 dB, or 0.18 % at best.

Moving to a 12-bit scope would improve the analog dynamic range to 72.2 dB, however the NFI would remain the same for an FFT total dynamic range of 87 dB, still not enough for observing those -100 dB harmonics.

A 16-bit scope would do it. With a 96.3 dB base it’s FFT could muster a 111.0 db range and the 0.001% harmonics would be distinctly visible with appropriate window selection and averaging.
Thank you to both of you for responding to my question, with the information posted above I have a much better understanding of this now.

Many thanks for the excellent explanation cliffyk!