[quote=“jrucker00”]I just bought the PCSGU220 Oscilloscope/Function Generator to test audio equipment. I am using the function generator’s sweep capabilities to run a 10Hz to 50kHz, 100ms sweep to test some preamp circuits. However, when I measure the sweep on CH1 or CH2 of the scope, the sweep is nowhere near uniform in amplitude. There is a huge notch in the waveform that decreases by 20dB (rough estimate) about 75% of the way through the sweep. The notch spans about 5 decades.
At first, I suspected that there was an issue with the function generator. But I tested the function generator’s output on two different oscilloscopes (one digital and one analog), and the output was just about perfect.
Next, I used an external function generator and monitored it on my new PCSGU220. The waveform displayed on my computer screen resembled the notch effect that I originally saw. This effect was present on both channels. I tried many different sweep settings (time, range, lin/log), and each sweep exhibited the notch effect.
When the time setting is increased, the notch effect decreases in magnitude. This leads me to question the oscilloscope’s ability to respond correctly to immediate changes in frequency.
Any immediate support in this issue would be greatly appreciated.[/quote]
I assume you have the PCSGU250 (right?), and that you have set the timebase to 10ms/division to capture the entire sweep?
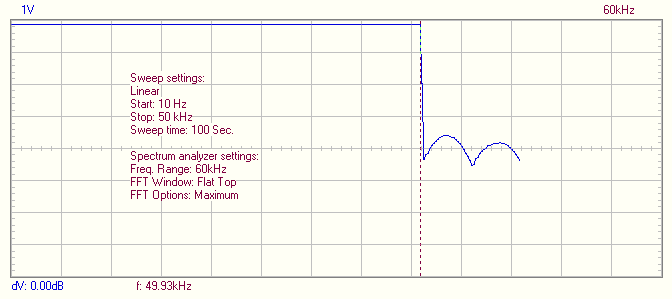
Is so then what is happening is that the sample rate is only 12.5kS/s, meaning the very best bandwidth you could achieve would br 6.25kHz (the Nyquist frequency, or 1/2 the sample frequency). What you are seeing is that bandwidth limit, and aliased response “above” the notch.
It probably looks somewhat like this:

The sample rate limitation here due to the 4k samples memory depth of the PCSGU250 and the sample rate chosen by Velleman’s engineers. At the 12.5kS/s sample rate the 4k memory fills up in 320ms; at 25kS/s it would fill in 160ms which seems as though it would be possible, however there may be some other reason for their selecting 12.5kS/s at 10ms/div.
Nonetheless, even if you could sample at 25kS/s it would still be inadequate for what you wish to do as the Nyquist limit would still be only 12.5kHz.
Have you tried using the software’s bode plotting (Circuit Analysis) capability? It works very nicely to do what you wish, including phase response. Here is a plot of the response of a small 10W stereo amp I designed, it has switchable “loudness” contour linked to the level control, this is the response at three level settings.
100%, 75%, and 30% level:

For reference, here are a couple of traces of the same sweep as shown above, however captured by my Lecroy Wavejet at 1k, and 100k points:
1k points:

100k points