Hello,
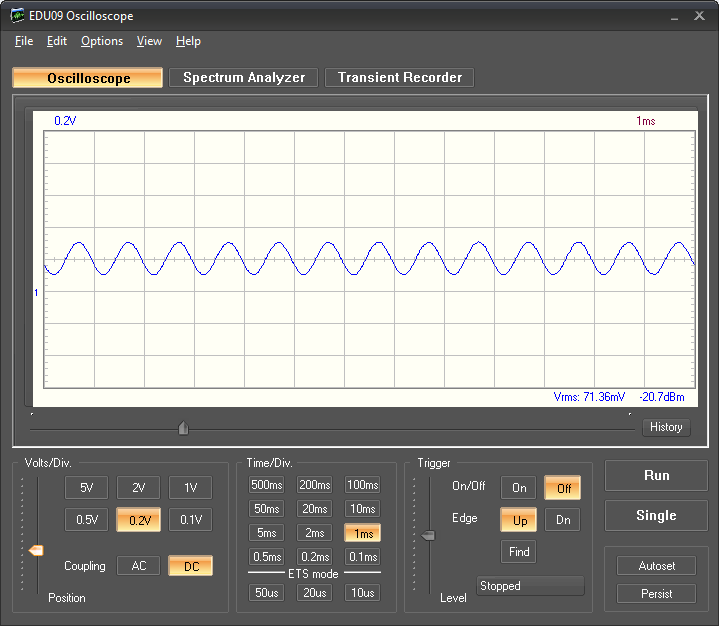
we used the Oscillospe and EDU09 to meassure the pressure in a tube and now want to analyze the recorded data. The only problem is that we are no electrical engineering students and cannot make sense of the values given in the bottom right corner.
We want to compute the mean value and amplitude of the signal only from the picture.
We are confused about the data given in the label on the bottom right (see attached picture) it seems like there is a graphic error.
Could someone help us by explaining the formula of vrms and their units. Important for us is the connection of these values to the mean value and amplitude. Thank you in advance!
![]()